Breakfast Plenary Session
Tony Dang, California Walks
Michele Hasson, Counsel for Justice & Accountability
Chanell Fletcher, Safe Routes to Shool National Parternship
Estuardo David Mazarigos, TRUST South LA
TD: We have to remove the financial strings attached to getting involved in advocacy
Case in point: I had to pay $200 for a one-day attendee registration fee!
MH: There's no data to use in proposals b/c safety issues are not accurately reported
 |
| Lead Organizer Estuardo Marzariegos |
TD: Walking plans are in place for only 50% of communities, plans should be community-driven rather than consultant-driven. Residents should define where they want to go.
EDM: Create a community that can stand up for itself. Host bike rides. Survey at the street level. Recruiting people in this way will empower them. Collect their stories.
Hold press conferences. Visit Councilmember's offices. Make inequity clear.
Out of 123 surveys, 38% of people have been in accidents, 67% use a bicycle as a primary form of transportation. Collecting the voices of constituents (mothers, workers) has been convincing.
CF: Complete streets need reporting; climate health, equity. If the project doesn't collect data the funding will be pulled. The new idea of "Low Carbon Roads."
MH: When a continuing dialogue is ongoing with politicial leaders, it's easier to push when the time is right. Continuing education at every interaction.
~~~~~~~~~~~~~~~~~~~~~~~~~~~~~~~~~~~~~~~~~~~~~~~~~
Best Marketing & Promotion Practices
Cory Wilkerson, City of Santa Ana
Ryan Johnson, Alta Planning + Design
Nathan Wheadon, Orange County Transportation Authority
CW: $150,000 grant for direct education (school assemblys, bike rodeos), marketing & design
RJ: Community surveys conducted including key stakeholders (police, engingeering & public works, city staff, Spanish language translators)
8 month funding cycle, which took 3-4 months to secure contracts
Survey results were translated into word clouds (Wordle): the prompt was
"How would you describe Santa Ana in 1 word if it were a person?"
Goals of the image campaign: not graphically violent, not humorous b/c humor can be lost in translation, more simplistic/positive/uplifting, the expectation is "Travel Safely"
How a single person in a single day can be all 3: pedestrian, cyclist, driver
Outcomes: 12 bus stop posters (3 months, $17,000)
36 pole banners placed in areas of high bike-ped collisions
Printed brochures, safety sheet, webpage
http://www.ci.santa-ana.ca.us/bike/
 |
| jenny@graphikdeziner.com |
18 school assemblies during April/May
10 new League-Certified Instructors were inducted in an LCI seminar
1000 helmets were distributed
NW: A
SWOT analysis is a way to begin a project, decide what/when to say something, choose a relevant/topical message, the audience is educating drivers
The best teachers use humor, voices, antics! If you can come up with a campaign and get the support of the more conservative board members, then it may eventually be approved.
Next campaign [B]right... be safe, be seen.
The video should be less than 60 seconds, educational, entertaining, positive, funny/creative.
The video should NOT be inspiring fear or victim-blaming.
The video can be distributed using social media (digital), at events (face-to-face), through email marketing, through print media (magazines, local newspapers) through a formal press release, and through your own network of contacts (city staff and bike advocates) ask them to share it!
It takes 2 months from the concept for a video to a publicly posted video, 2 weeks of filming
5 videos were made at a cost of $20,000
~~~~~~~~~~~~~~~~~~~~~~~~~~~~~~~~~~~~~~~~~~~~~~~~~
On the Cutting Edge of Quantifying the Public Health Benefits of Bicycling
Dan Gallagher, San Diego Association of Governments
Sherry Ryan, San Diego State University
David Flores, Casa Familiar
Peter Jacobsen, Public Health Consultant
Sean Co, Toole Design Group
Carla Blackmar, Public Health Alliance of Southern California
DG: The built environment effects community behaviors, correlations between the geographical environment and health factors were calculated and used to prioritize infractructure projects
Active Transportation (trails, parks, sidewalks), Injury Prevention, Nutrition, Air Quality
all granular data fed into the model... Compared San Ysidro versus all San Diego County
Partial Correlations Analysis used to determine which factors had the most impact on health
http://sandag.maps.arcgis.com/apps/MapJournal/?appid=fc149b3233eb48e796dd8e40d7e6eac4
SR: the percent difference between San Ysidro versus San Diego city was used to identify ramps and lighting, landscaping, traffic calming, new parks, wayfinding, crosswalks, bike lanes that could improve the health of San Ysidro
DF:
promotoras are community leaders of health that volunteer to boost community awareness
they receive in exchange for their leadership training in first aid, zumba, which builds their skills.
PJ: He was a contributor to the Bike Plan for the City of Pasadena and noticed that the amount of cyclists in a city actually decreased the risk of injury (collisions b/w cars and cyclists)
If you double the # of cars, you double the # of collisions b/w cars but the same is not true for cyclists/pedestrians "Safety in Numbers"
The reasons for this are twofold 1) physiology 2) psychology
Physiologically we evolved to understand a 15 mph pace, beyond that our minds simplfy situations and ignore some of what is going on. This is a learned behavior
Psychologically, rare events are hard to detect. When there are fewer cyclists, drivers simply don't recognize them or "see" them. If cyclists are commonplace, they're easier for drivers to "see"
Driver education alone is insufficient/unsuccessful, it's better to encorage more people to bike/walk
SC: Montlhy pass riders in Washington DC choose to take BikeShare instead of walking (35%) or taking public transportation (45%), but ~13% of them would have otherwise taken a car or taxi.
The motivation was for time savings (73%) and exercise (41%) even though 23% admit the BikeShare is more costly than other means of transportation.
CB: Public health benefits are important to measure and will be required as a part of future proposals for funding. Active Transportation has a greater impact on quality of life benefits when compared with "Low Carbon Driving" Water infrastructure should be a part of complete streets plans
Active transportation accounted for a 7% reduction in depression and 5% decrease in breast/colon concer, a 13% reduction in cardiovascular disease and diabetes, a 9% reduction in dementia
~~~~~~~~~~~~~~~~~~~~~~~~~~~~~~~~~~~~~~~~~~~~~~~~~
Modeling Benefits & Costs for Equity & Connectivity
Sherry Ryan, San Diego State University
Laura Cohen, Rails-to-Trails Conservancy
Michael Jones, Alta Planning + Design
Eric Anderson, City of Berkeley
Brett Hondorp, Alta Planning + Design
 |
| We rode past this counter on Wed 10/25/15 |
SR: $300,000 investment to monitor 37 sites in San Diego County
24 bike-only counters (in street) Class II, III bike infrastructure
9 bike/ped counters for Class I bike infrastructure
4 ped-only counters (sidewalks, urban)
Goal: track trends over time as the bike network was built out
SR: when a buffered bike lane opened, the # of cyclists per month jumped from 1000-1500 to 1800-3000 per month, which is roughly double. On a scatterplot this data looks awesome.
New "rules of thumb" found that 16.5% of cycling activity occurs between 4-6 pm regardless of whether the counts were done in San Diego or Maricopa counties
http://www.eco-public.com/ParcPublic/?id=681 is the link to live count data
Class I bike paths were more used on weekends, whereas Class II and III were used on weekdays
LC: Trail Modeling and Assessment (T-MAP) tool
3 year $1,200,000 effort to collect data, model the data, and disseminate the info to the public
"Trail Score" likened to Walkability score. The question is "What % of the population can get to a majority of their destinations using a low-stress route?" The goal is that by 2020, 90% of Americans will live within 3 miles of a trail system
MJ: National Bike & Pedestrian Documentation (NBPD) recommendations stipulate that if you do a bike/ped count only once per year that it happens on the 2nd week of September. You may consider 4th of July the peak and try to count on both weekday and weekend.
Rather than choosing random placement of counters, consider relevant places within your transportation network.
http://bikepeddocumentation.org/
Key Findings: 76% of walking trips and 29% of biking trips are for work or essential activities
70% of respondants biked once per week
MJ: Alta Benefits Cost Model (ABC) takes into account reduction in greenhouse gases
Property values (of real estate) increased $2,200,000 within 500 ft of bike/ped projects
BH: Strong & Fearless = will ride no matter what; Enthusiastic & Confident = need bikeways; Interested but Concerned = the majority of people; No Way, No How = won't ride anyway
To reach all people there was a random sampling by zip code and a door-to-door survey on a tablet showing streets in their community with either: no markings, sharrows, bike lanes
The streets shown in the mock-ups were residential all the way to arterial streets
A segregated cycletrack was preferred and least desirable was a 4-lane arterial with fast traffic
 |
| Note: this graphic was re-created in Google Sheets based on percentages presented in the session |
~~~~~~~~~~~~~~~~~~~~~~~~~~~~~~~~~~~~~~~~~~~~~~~~~
Coronado Bike Tour
Mariah VanZerr, City of Coronado Transportation Planner
John Holloway, KTU+A Planning + Landscape Architecture
Met some good people on this outing!
If you ride from Los Angeles to San Diego, it can be done in 2 days, camp at Doheny!
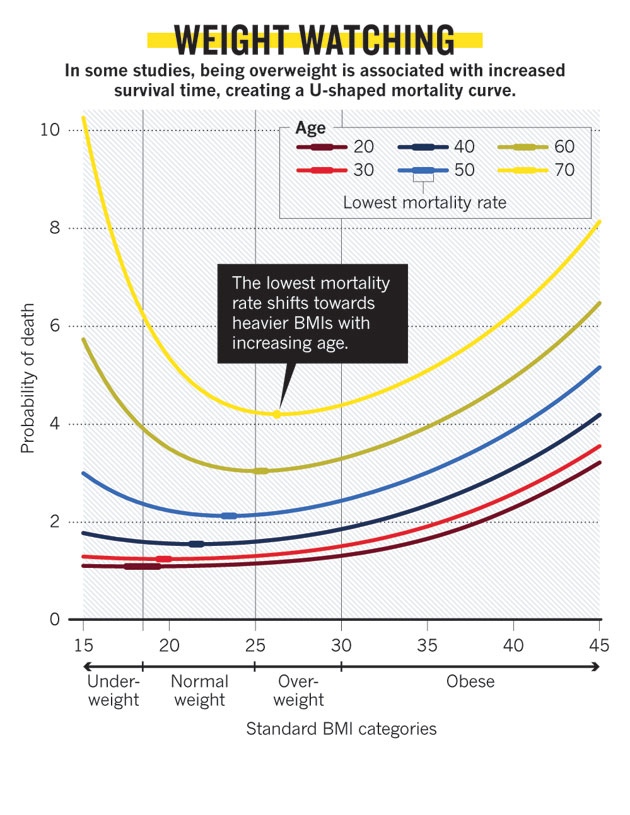 And, this may sound horrible, but for me in my 30s or my husband in his 40s the probability of death is not even doubled by having a BMI of 35 (or 32, respectively). I guess one wouldn't want to knowingly engage in behaviors that would knowingly double one's risk for death, but we do dangerous things all the time. I don't know what it is that makes my weight go up and down, it's complicated. I've tried using electronic devices, tracking calories, beating my body into submission to get into that "Normal" bracket. Unfortunately, happiness is more difficult to quantify.


